If I may briefly direct your attention to this awesome Census mapping tool that the New York Times put together. The colorful maps of track income, racial breakdown, education, and other demographic info for every single neighborhood in the US of A.
Wow. I think one of the most interesting stats is tracking income in Portland. Look where income grew and declined since 2000 (the deeper the blue, the darker the decline. Brighter yellow equals increasing income):

The outer Lents/Montavilla neighborhood is the hardest-hit local area of the past 10 years, with median household income having sunk 35 percent to $33,255. The biggest increase is in the central city, where the area west of the Pearl along the 405 apparently jumped 99 percent in income (uh... is that an error?). The neighborhood with the highest median income is Irvington, with the homes around NE 24th and Knott pulling in an average $118,875 (and growing!).
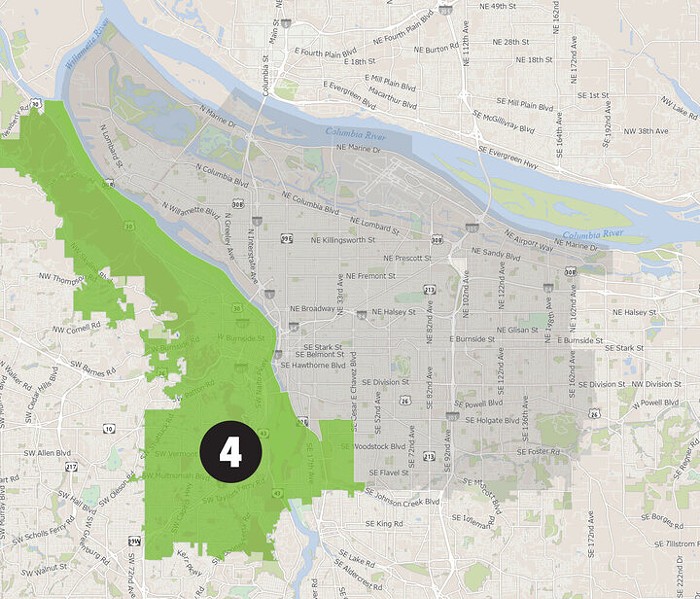
Also interesting: Neighborhoods with the most unmarried same-sex couples (greener=gayer). These stats does not include the 2010 census data, which was the first year the census stopped treating married same sex couples as a clerical error.